
On this page
Unlock your product's full potential with targeted KPIs! Track user engagement, set clear benchmarks, and continuously refine based on real-world data to drive success and boost user satisfaction.
Develop and track key performance indicators that align with the product’s objectives to assess its success and user adoption.
- Define Key Performance Indicators (KPIs): Identify the key metrics that will be used to measure the success and adoption of the product or feature. These should be closely aligned with the objectives of the product or feature.
- Track KPIs: Set up a system or process to regularly track and monitor these KPIs. This could involve using analytics tools, surveys, user feedback, etc.
- Choose Relevant KPIs: Ensure the KPIs chosen provide meaningful insights into the performance of the product or feature. They should be able to accurately reflect whether the objectives of the product or feature are being met.
- Identify Metrics: This could include metrics like user engagement (how often and how long users interact with the product or feature), usage frequency (how often the product or feature is used), adoption rate across teams (how quickly and widely the product or feature is being adopted by different teams), user satisfaction scores (how satisfied users are with the product or feature), and other meaningful metrics.
Examples
Here are some examples of Key Performance Indicators (KPIs) and metrics that can be particularly insightful for this purpose:
Adoption Rate:
- Total Number of Active Users: The total count of users who have interacted with the tool within a specific timeframe.
- New User Growth Rate: The rate at which new users begin using the tool over time.
Usage Frequency:
- Daily/Monthly Active Users (DAU/MAU): Measures how many unique users engage with the tool daily or monthly.
- Session Length: The average amount of time users spend using the tool during each session.
User Engagement:
- Feature Utilization: Percentage of available features that are actively used by the users.
- Click Through Rate (CTR) on Tool Features: Measures how often users interact with specific features after seeing them.
Performance Efficiency:
- Load Time: Measures the time taken for the tool to become fully operational after initiation.
- Downtime: Tracks the amount of time the tool is unavailable or not functioning as expected.
User Satisfaction:
- Net Promoter Score (NPS): Gauges user satisfaction and loyalty by asking users how likely they are to recommend the tool to others.
- User Satisfaction Surveys: Regular surveys to collect qualitative feedback about the tool’s usability and functionality.
Integration and Compatibility:
- Integration Success Rate: Percentage of successful integrations with other systems or tools without issues.
- Issue Resolution Time: Measures the time taken to resolve issues that arise during integration.
Quality Metrics:
- Error Rates: Tracks the frequency of errors encountered by users while using the tool.
- Bug Fix Rate: Measures how quickly identified bugs are resolved.
Business Impact:
- Productivity Improvement: Measures the improvement in operational efficiency or reduction in time spent on tasks due to the tool.
- Cost Reduction Metrics: Quantifies cost savings resulting from the tool’s deployment.
Baseline Metrics
Once you have identifed how you will be measuring success you need to create Baseline Metrics.
- Set Benchmarks or Targets: For each KPI, establish a benchmark or target that represents the desired level of performance. This provides a clear goal to aim for and a standard against which performance can be measured.
- Monitor and Analyze Performance: Regularly review the product or feature's performance against the set KPIs and benchmarks. Analyze the data to identify trends, areas of success, and areas that need improvement.
- Adjust and Improve: Based on the performance analysis, make necessary adjustments to the product or feature to improve its performance and better meet its objectives. This could involve making changes to the product or feature itself, or to the strategies used to promote its adoption and use.
Burn Down Metrics
A burn-down rate is a metric commonly used in project management, including in contexts such as migrating from one tool to another within an organization. It essentially measures the rate at which work is completed against the total work expected over time, often visualized in a burn-down chart. Here's how you can set up and use a burn-down rate to monitor the migration from an old tool to a new platform tool:
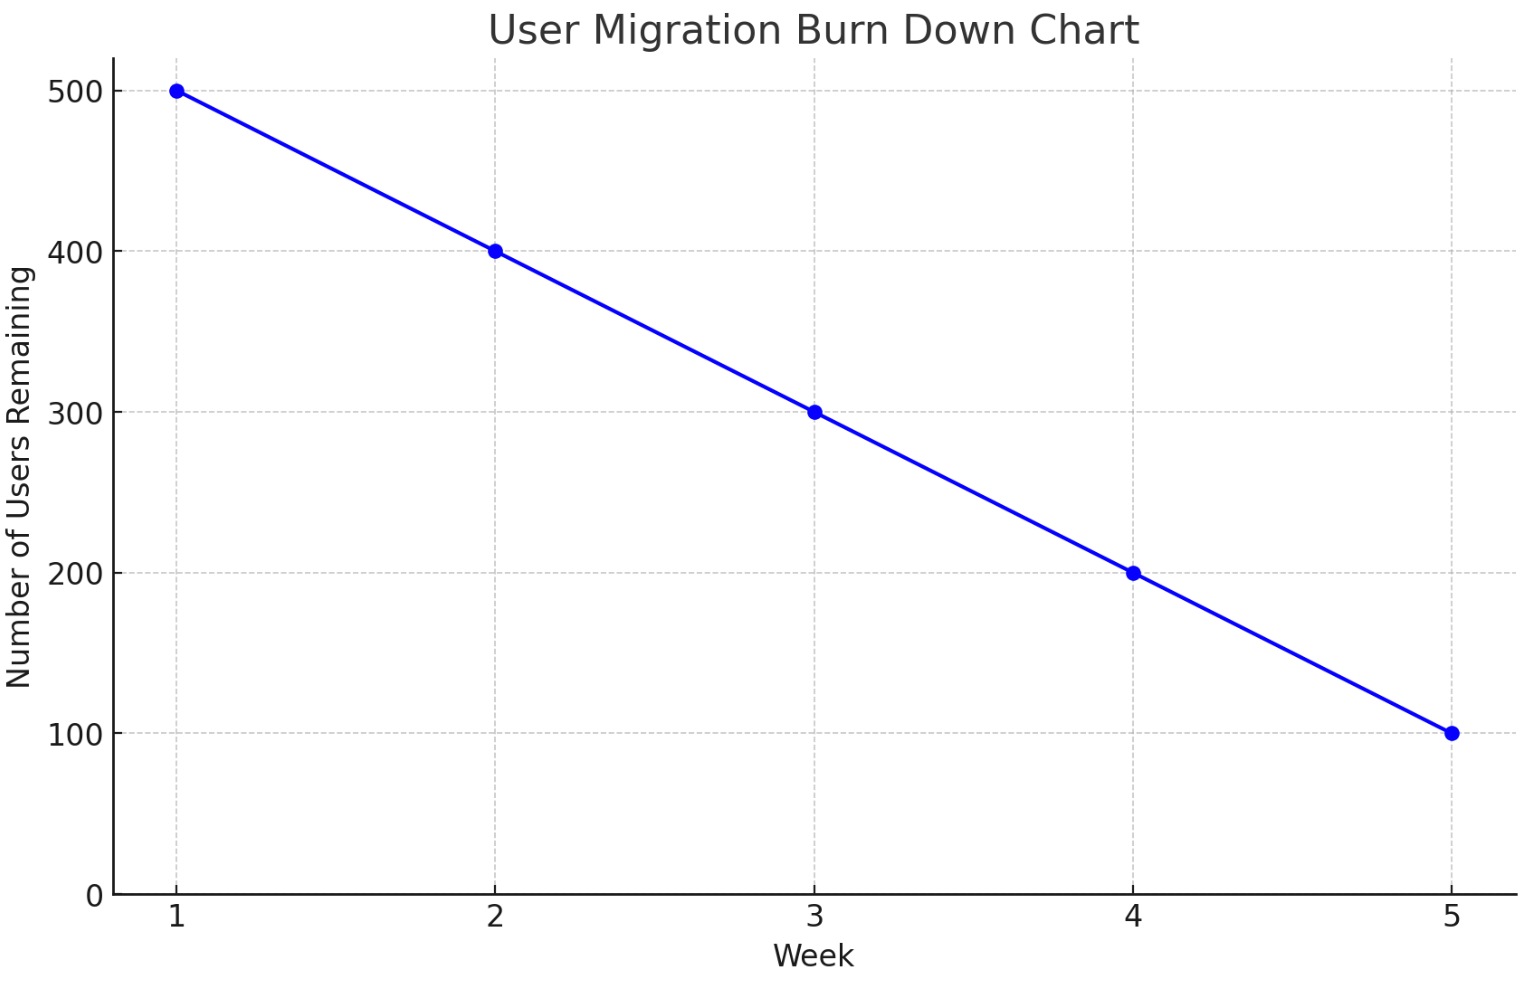
Example: User Migration Burn Down Rate
Objective: Migrate 500 users from Tool A to Tool B.
Time Frame: The entire migration is scheduled to be completed within a 5-week period.
Steps to Setup and Use Burn Down Rate for User Migration:
- Define Total Users:
Begin with the total number of users that need to be migrated, e.g., 500 users. - Set Up a Time Frame and Weekly Targets:
Divide the 5 weeks into smaller intervals, typically one week, and set targets for each week based on an even distribution or as planned according to available resources and complexity. For example, you might aim to migrate 100 users per week. - Track Migrated Users Weekly:
At the end of each week, count the number of users successfully migrated to the new tool. - Calculate Remaining Users:
After each weekly count, calculate the remaining number of users to be migrated by subtracting the number of migrated users from the total. For example, if 100 users are migrated in the first week, 400 users remain. - Update the Burn Down Chart:
Plot these numbers on a burn down chart:- The Y-axis represents the number of users left to migrate.
- The X-axis represents the elapsed weeks.
- The chart should start at 500 users at the beginning and ideally reach 0 by the end of the 5th week.
- Monitor and Adjust:
- Monitor the chart regularly to see if migration is on track. A consistent downward slope indicates that migrations are proceeding as planned.
- If fewer users are migrated than planned in any week (e.g., only 80 users in the second week, leaving 320 users instead of the projected 300), investigate and identify any bottlenecks or issues causing delays.
- Adjust strategies, increase resources, or extend user support to catch up in the following weeks.
Benefits of Using the Chart:
- Visibility: Provides clear visibility into the migration progress, showing how many users are left to migrate.
- Accountability: Ensures that the migration team stays on target and addresses any delays promptly.
- Adjustment: Allows for real-time adjustments in strategy or resource allocation to meet the planned timeline.
This burn-down chart serves as a practical tool for managing the migration process effectively, ensuring that all users transition smoothly to the new tool within the designated timeframe.